


Graphic notations
Visual musical scores, map for grasslands, teachable machines
Hello,
I’m popping in with a new and short edition of Data Curious. Somewhere along the past few months, this newsletter passed 1000 subscribers. That milestone was maybe the nudge I needed to return to writing these little dispatches.
To be honest, less and less of my time (work and otherwise) is being spent on what this newsletter started being—data visualization. There’s still some of that, but my work and interests continue to expand into more sonification, creative coding, and abstract expressions of data. There’s still a through-line though from where I started in data journalism—and the through-line is what interests me. I think that’s really what this newsletter is about anyways.
For this edition I’m thinking a lot about experimental music notations and their visual language. I also recently I finished a project with the Cornell Lab of Ornithology, which as a birder, was a huge privilege for me (more on that project below). And I’m inching into some machine learning on the web for an upcoming project.
More on all that, with links, below. Thanks for reading!
Read / Look

Graphic notation: a brief history of visualizing music
Lately I’ve been really taken by experimental music scores. Compared to traditional scores, graphical scores have a huge range expressiveness. The first time a visual score really clicked for me was Brian Eno’s Music for Airports:

Although they can be a bit cryptic at first, once you “decode” the system I find them quite beautiful and informative. If you have ever struggled with “how should I encode this data visually” then this challenge should feel familiar. There’s a sublime overlap between visual displays of data and experimental music notation.
If you want to fall down this rabbit hole further, start with the history. Then you can find some new examples of experimental notations on this lines forum thread, which also led me to a Smithsonian Mag piece highlighting examples of experimental notation.
Explore
Map for Grasslands
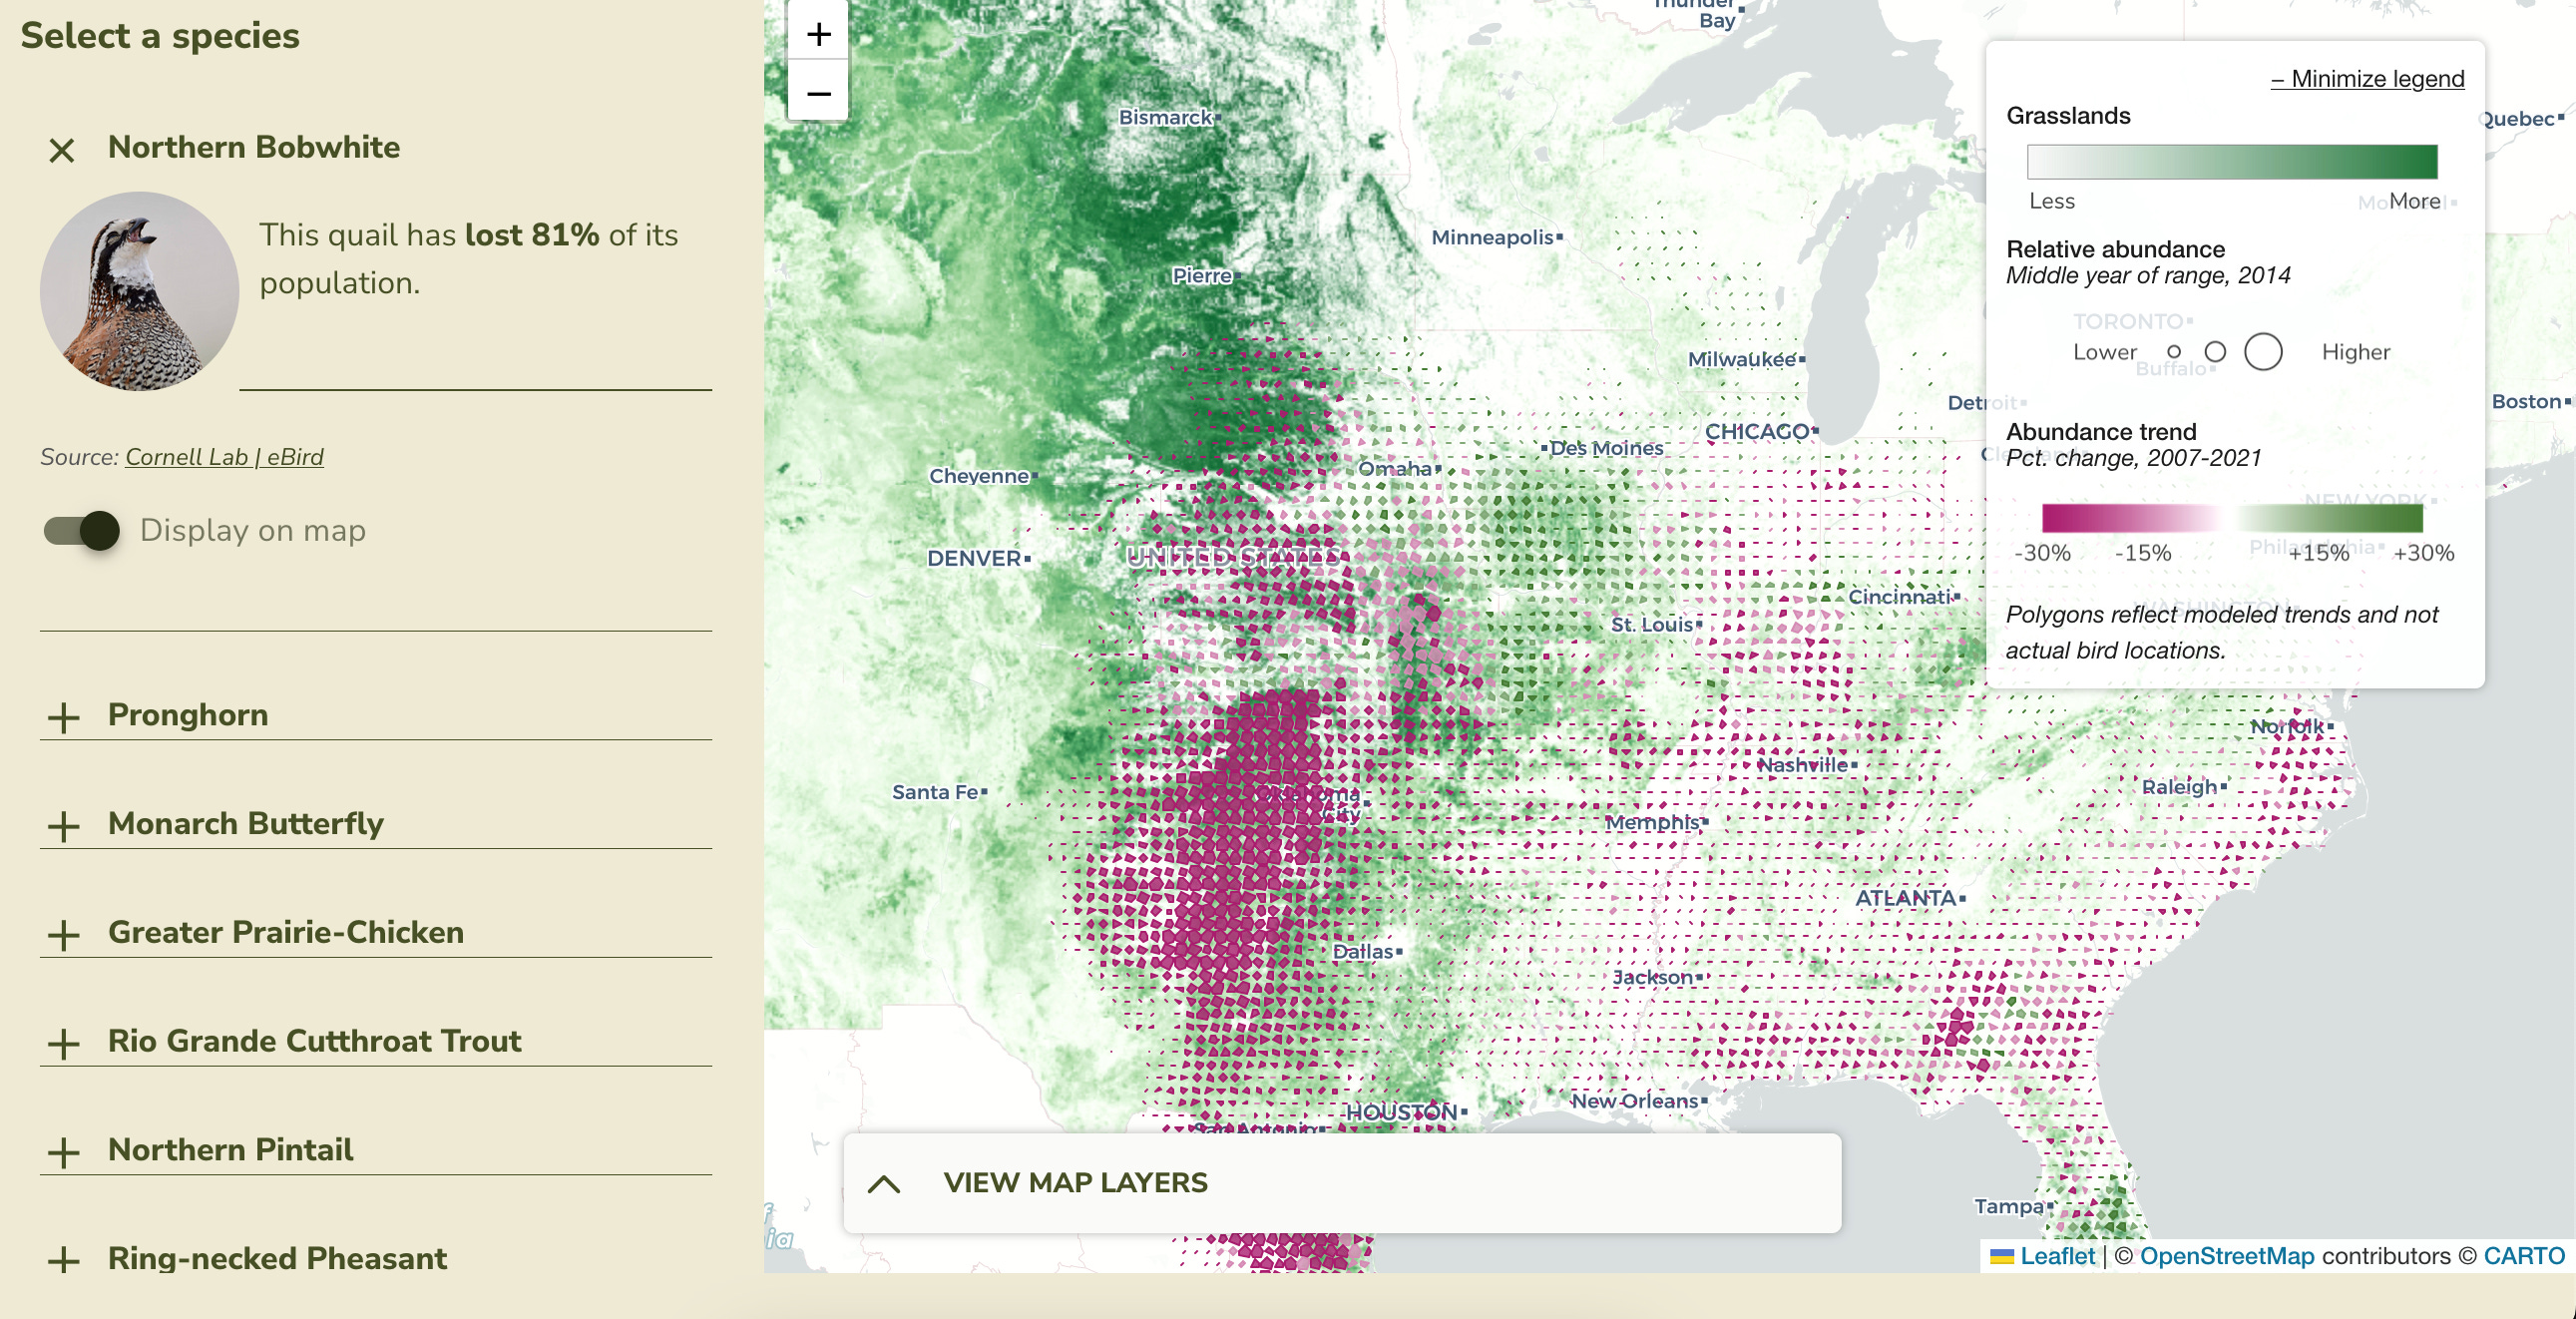
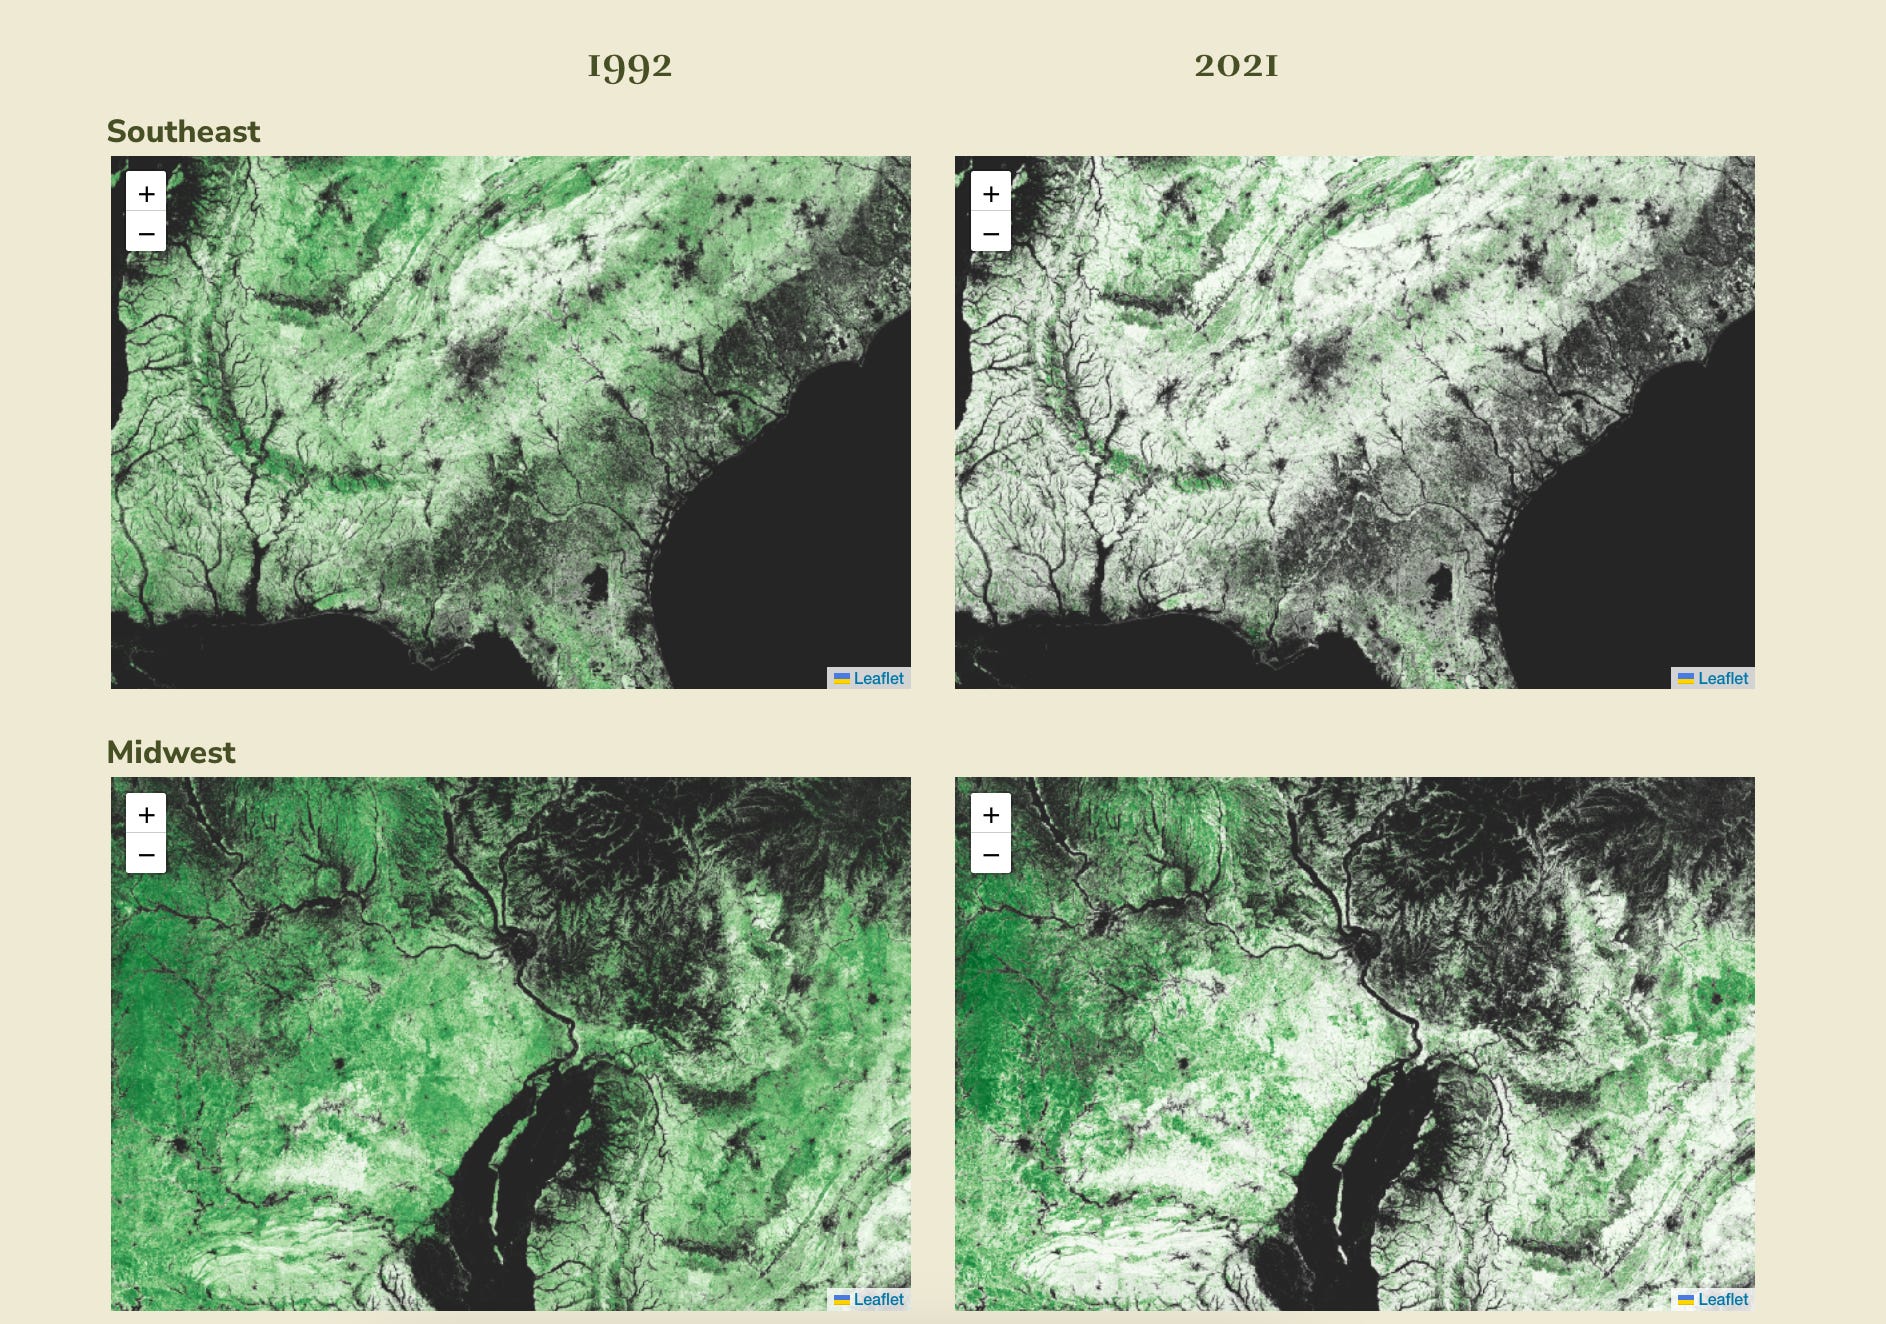
I’m happy to finally share a site that I worked on for the better part of a year: Map for Grasslands is an interactive website that visualizes the amount of loss across America’s grassland ecosystems. On average, our nation is losing 2.5 million acres of grasslands annually. The USGS estimates that over 62% of all America’s grasslands have been lost.
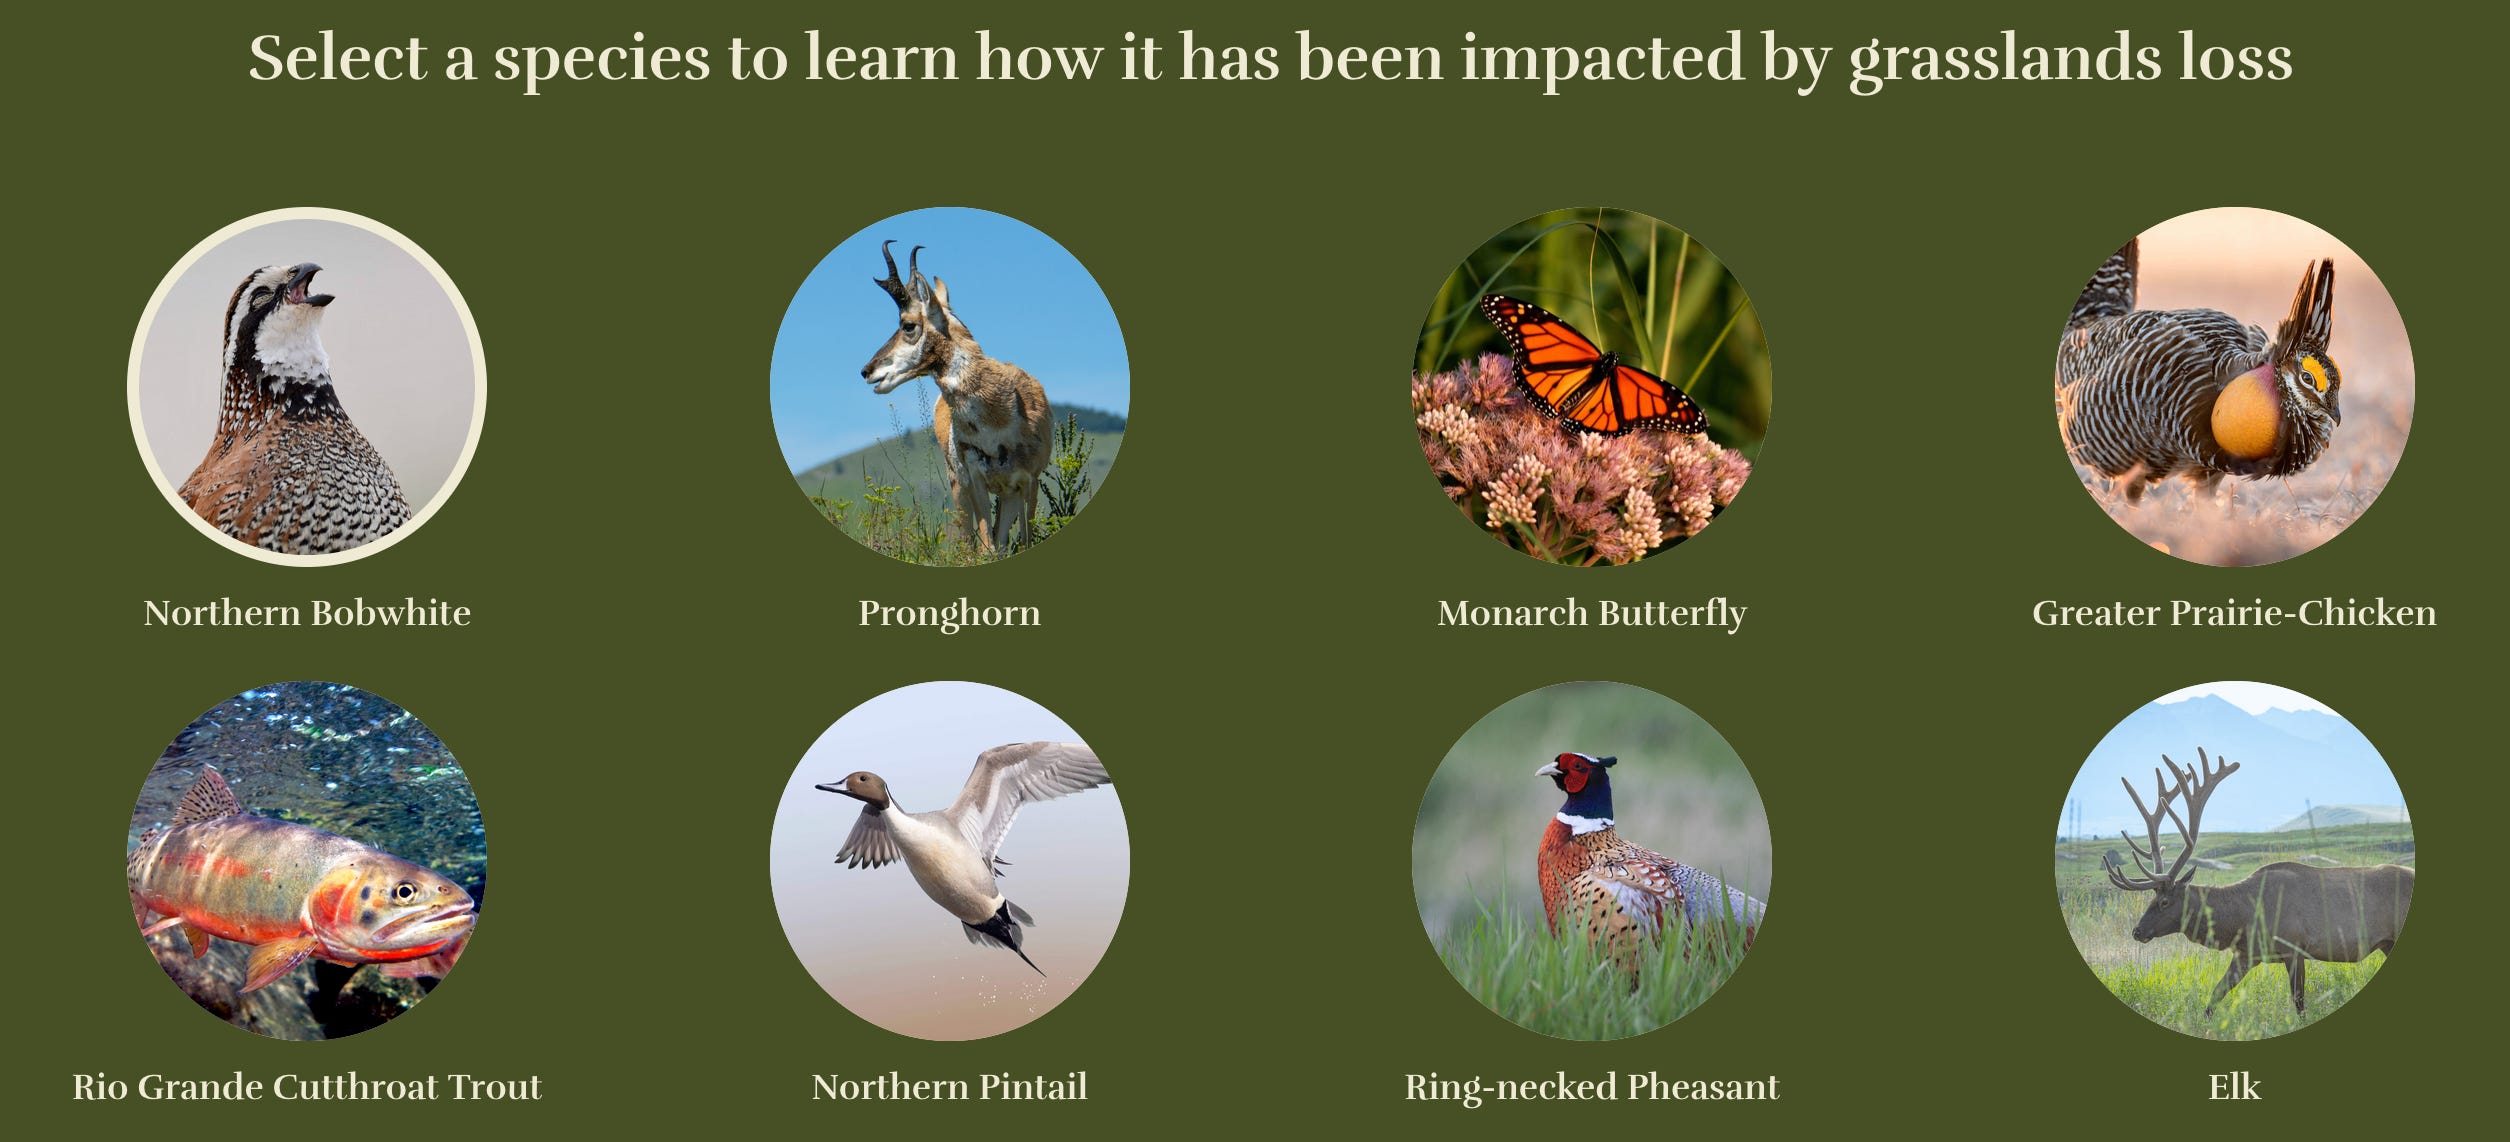
In collaboration with the Cornell Lab of Ornithology, we created a web tool that shows how this loss is affecting wildlife species. This tool is mean to raise support for the North American Grasslands Act, a national plan to protect and restore our grassland habitat.
At the core of the site is our “species explorer”, which allows the user to select one of 15 species to dive deeper. I won’t go into detail here, but some of the stats really took the wind out of me: Northern Bobwhites have lost 81% of its population, Monarchs have lost 80%, and the Bobolink has lost 50%, all in the past 25 years.
The project was challenging technically, but I was more surprised by how challenging it was mentally: to spend hours and hours with this data, thinking about how to visualize and communicate loss in a way that sparks urgency (action) while not sliding into despair (apathy). Even when it feels helpless though, the truth is that we’ve done it before: the North American Wetlands Conservation Act, passed in 1989, has contributed to the conservation of almost 32 million acres of wetlands in the United States. Now we need the same for our grasslands.
Explore the full site here, read more about the Grasslands Act here, and tell members of Congress you want this bill passed to protect grasslands wildlife by filling out this 2-minute simple form.
Learn

Teaching Machines in the browser
I have an upcoming sound installation project that will require some computer vision / machine learning. And while I likely know enough Python to train a model in a notebook, I’m interested in giving Google’s “Teachable Machines” a spin. I found this through the ML5.js documentation page—which I know I have mentioned this library before, and still think it’s a fantastic tool. If anyone has experience with this model or training method, let me know in the comments or replies!